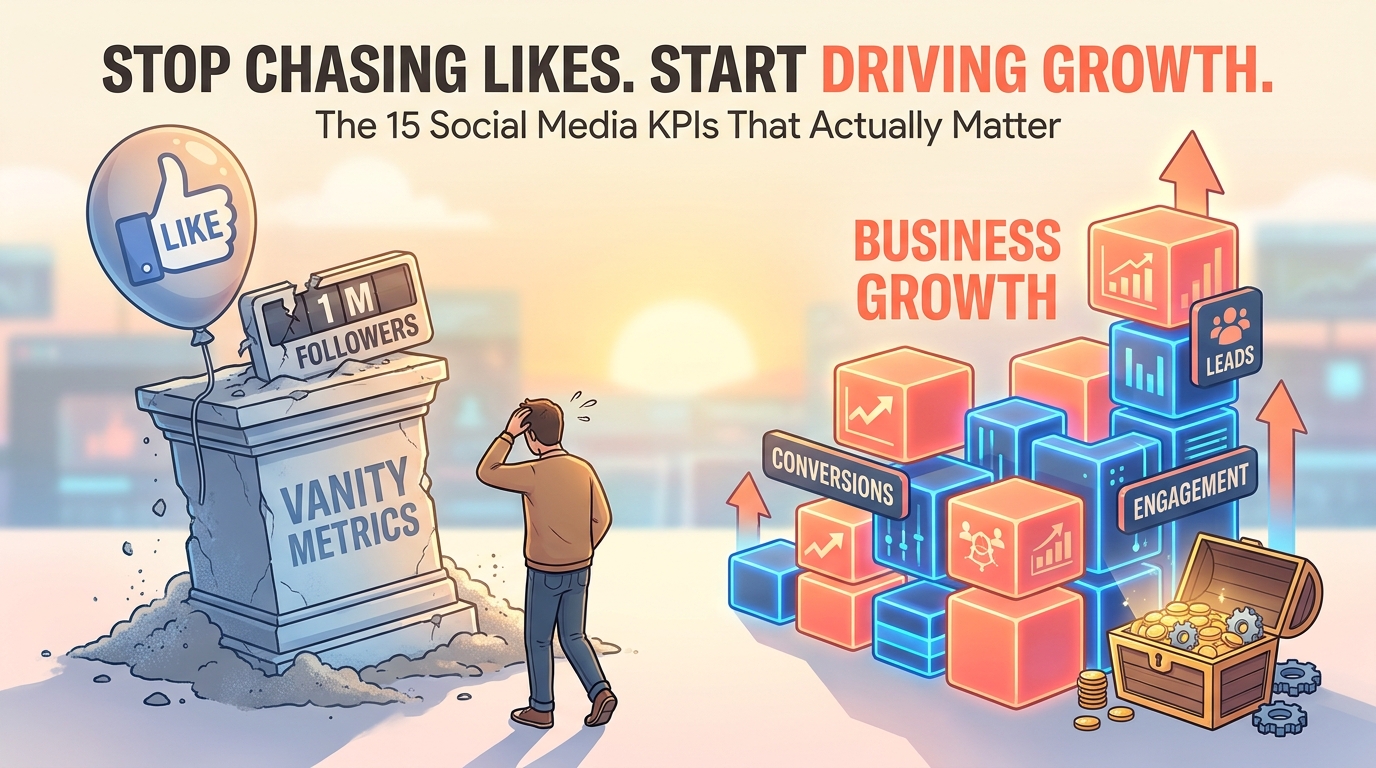
15 Social Media KPIs That Actually Drive Revenue (Not Vanity Metrics)
You're tracking follower counts and likes. But let's be honest — has a follower spike ever shown up in your bank account? Vanity metrics feel good, but they don't pay the bills. If you want to prove social media ROI and make decisions that grow your business, you need to track the right KPIs.
Here's the truth: the best-performing brands measure engagement quality, conversion paths, and customer sentiment — not just surface-level numbers. In this guide, you'll discover 15 metrics that correlate with real business outcomes, how to benchmark them, and why centralized dashboards save hours of guesswork ✨.
Why Vanity Metrics Are Holding You Back
Follower count looks impressive on a pitch deck. But it doesn't tell you who's buying, what content drives action, or where your audience drop-off happens.
The problem? Most founders waste time chasing metrics that don't connect to revenue. You optimize for reach when you should optimize for resonance. You celebrate viral moments that don't convert. Meanwhile, your actual growth levers — engagement depth, attribution, sentiment — go unmeasured.
Smart builders focus on KPIs that answer: "Is this working?" and "What should I do next?"
The 15 KPIs That Matter for Business Growth
These metrics connect directly to revenue, retention, and strategic decisions. Track them consistently, and you'll know exactly what's driving results.
1. Engagement Rate (Per Post)
Total interactions (likes + comments + shares) divided by reach or impressions. This shows how compelling your content is — not just how many people saw it.
Benchmark: 1-3% is solid for most industries. Above 5% means you're creating highly resonant content.
2. Engagement Quality Score
Not all engagement is equal. A comment is worth more than a like. A share is worth more than a save. Weight interactions by intent and effort.
How to calculate: Assign point values (comment = 3, share = 5, like = 1), then divide by total interactions. Higher scores = deeper connection.
3. Click-Through Rate (CTR)
Percentage of people who click your link after seeing your post. This measures how well your content drives action beyond the platform.
Benchmark: 0.5-2% is typical. Optimize CTAs, headlines, and link placement to improve.
4. Conversion Rate (Social Traffic)
Percentage of social visitors who complete a goal — sign-up, purchase, demo request. This ties social media directly to business outcomes.
Track this in GA4 or your CRM. Tag UTM parameters so you know which posts and platforms convert best.
5. Cost Per Acquisition (CPA) from Social
Total spend (ads + tools + time) divided by customers acquired. Lower CPA means more efficient growth.
Why it matters: Organic social has costs too (your time, software). Measuring CPA keeps you honest about what's working.
6. Customer Lifetime Value from Social Channels
Average revenue per customer acquired through social media. If your social CLV is higher than other channels, double down.
Insight: Often, social customers have higher retention because they've engaged with your content before buying.
7. Sentiment Score (Automated Analysis)
Positive, neutral, or negative sentiment across comments, mentions, and DMs. Use AI tools to track sentiment at scale, even across multiple languages.
Why track it: Sentiment predicts brand health. A dip signals problems before they hit revenue. A spike shows messaging resonance.
8. Response Time and Rate
How quickly you reply to comments and messages, and what percentage you respond to. Fast, consistent responses build trust and boost engagement algorithms.
Target: Under 2 hours for DMs, 100% response rate for genuine questions. Automate acknowledgment, personalize follow-ups.
9. Share of Voice (SOV)
Your brand mentions divided by total mentions in your category. Higher SOV means you're winning mindshare in your market.
Track this: Use social listening tools. Compare your SOV to competitors quarterly to measure brand momentum.
10. Follower Growth Rate (Not Just Count)
Percentage increase in followers over time. Growth rate contextualizes follower count — 1,000 new followers means more at 5k than at 500k.
Benchmark: 2-5% monthly growth is healthy for most brands. Spikes without engagement usually mean bot follows.
11. Audience Retention (Cross-Platform)
Percentage of your audience that stays active across platforms over 90 days. High retention means loyal community, not just passing traffic.
How to measure: Track engaged users in platform analytics. Declining retention signals content-market fit issues.
12. Content Efficiency Ratio
Results (clicks, conversions, engagement) divided by content volume. This tells you if you're creating the right amount of content or just noise.
Use it to: Cut underperforming content types, double down on high-performers. Quality over quantity always wins.
13. Cross-Platform Customer Journey Metrics
How many touchpoints before conversion? Which platforms drive awareness vs. conversion? Map the path from first interaction to customer.
Example: LinkedIn drives awareness, email nurtures, Twitter closes. Knowing this lets you optimize each channel's role.
14. Attribution by Content Type
Which content formats drive conversions? Compare video, carousel, text, infographic performance across the funnel.
Insight: You might discover short videos drive awareness but long-form posts convert better. Adjust your mix accordingly.
15. Time Saved via Automation
Hours reclaimed by automating scheduling, reporting, and content creation. This isn't traditional, but it's critical for sustainable growth.
Why it matters: Every hour saved is an hour you can spend on strategy, product, or high-leverage activities. Track it like revenue.
How to Benchmark Your Performance
Raw numbers don't mean much without context. Here's how to benchmark effectively:
- Compare against yourself first: Month-over-month and quarter-over-quarter trends show if you're improving.
- Use industry averages: Different niches have different benchmarks. B2B SaaS engagement rates differ from e-commerce.
- Segment by channel: Instagram engagement rates are typically higher than LinkedIn. Don't compare apples to oranges.
- Track cohorts: Group customers acquired in the same month, track their CLV over time. This reveals retention patterns.
Most importantly: pick 5-7 core KPIs to review weekly. Track the rest monthly. Too many metrics create analysis paralysis.
Why Centralized Dashboards Change Everything
Tracking 15 KPIs across 4+ platforms used to mean hours of spreadsheet work. You'd pull data from Instagram, Twitter, LinkedIn, analytics tools, your CRM — then try to make sense of it all.
Centralized dashboards solve this. They aggregate data automatically, visualize trends, and highlight what's working. You see cross-platform performance at a glance, make faster decisions, and spend time optimizing instead of reporting.
What to look for:
- Real-time data syncing across platforms
- Customizable views by team, brand, or campaign
- Automated alerts when KPIs hit thresholds
- Attribution tracking from social to conversion
- Multi-language sentiment analysis
This is exactly why we built Agent Mio — AI agents pull metrics from all your channels, analyze performance, and surface insights you'd miss manually. You see what's driving growth, what's wasting time, and where to focus next. No more guessing, no more spreadsheet gymnastics.
How to Take Action on Your KPIs
Data without action is just noise. Here's how to turn metrics into growth:
- Set thresholds: Define what "good" looks like for each KPI. Example: engagement rate below 1% = content needs refresh.
- Run experiments: Test new content types, posting times, CTAs. Measure impact on your core KPIs.
- Double down on winners: When a post or campaign outperforms, analyze why. Replicate that success.
- Cut losers fast: If a content type or platform consistently underperforms, redirect resources.
- Review weekly: Fifteen minutes to check core KPIs, spot trends, adjust strategy. Make it routine.
The best part? When you track the right metrics, improvements compound. Better content drives better engagement drives more conversions drives higher CLV. It's a flywheel.
Start Tracking Metrics That Matter
Vanity metrics might boost your ego, but business metrics boost your revenue. Track engagement quality, conversion paths, sentiment, and efficiency — and you'll know exactly what's working.
The hardest part isn't deciding what to measure. It's pulling data consistently, analyzing it accurately, and acting on it quickly. That's where automation makes the difference.
Ready to track KPIs that drive growth without the busywork?Try Agent Mio free — AI agents handle data collection and analysis, you focus on strategy and growth ✨.
#AgentMio #SocialMediaManagement #AIContentCreation #BuilderTools #ContentMarketing #GrowthHacking #AIAutomation #SoloBuilder